Can ChatGPT be Added to a Dashboard?
The answer is yes!
Welcome to a peek into one of my recent adventures in the realm of data analytics and AI! I'm happy to share my experience integrating a language model (LLM) chatbot into a Power BI dashboard, an illustrative project that not only flexed my technical muscles but also added a dynamic twist to data interaction. Here's how I brought this idea to life, step by step.

Step 1: Setting Up the Foundation
Every great project starts with a plan and a place to store all the magic. **Github has entered the chat**. I set up a repository to keep my code organized and accessible. This step is crucial for version control and collaboration, even though this time, I was flying solo.
Step 2: Gathering the Data
The backbone of any data analytics project is, unsurprisingly, the data. I wrote a Python script to fetch financial data from Yahoo Finance using the yfinance API. This package is incredibly useful for pulling historical financial statements and market data, and it's also straightforward to use.
Step 3: Preparing the Data
With access to the raw data, my next task was to structure it for a dashboard. I used the pandas library, a linchpin in the data science community, to parse the financial statements and transform them into a format ready for deeper analysis.
Step 4: Storing the Data
To keep the data organized and accessible, I opted for a local MySQL database. This involved defining schemas and ensuring the data's integrity, setting the stage for seamless retrieval.
Step 5: Linking Data to Power BI
With the data neatly stored in MySQL, I connected Power BI to the database. Power BI's ability to integrate with various data sources makes it an invaluable tool in my toolbox.
Step 6: Building the Dashboard
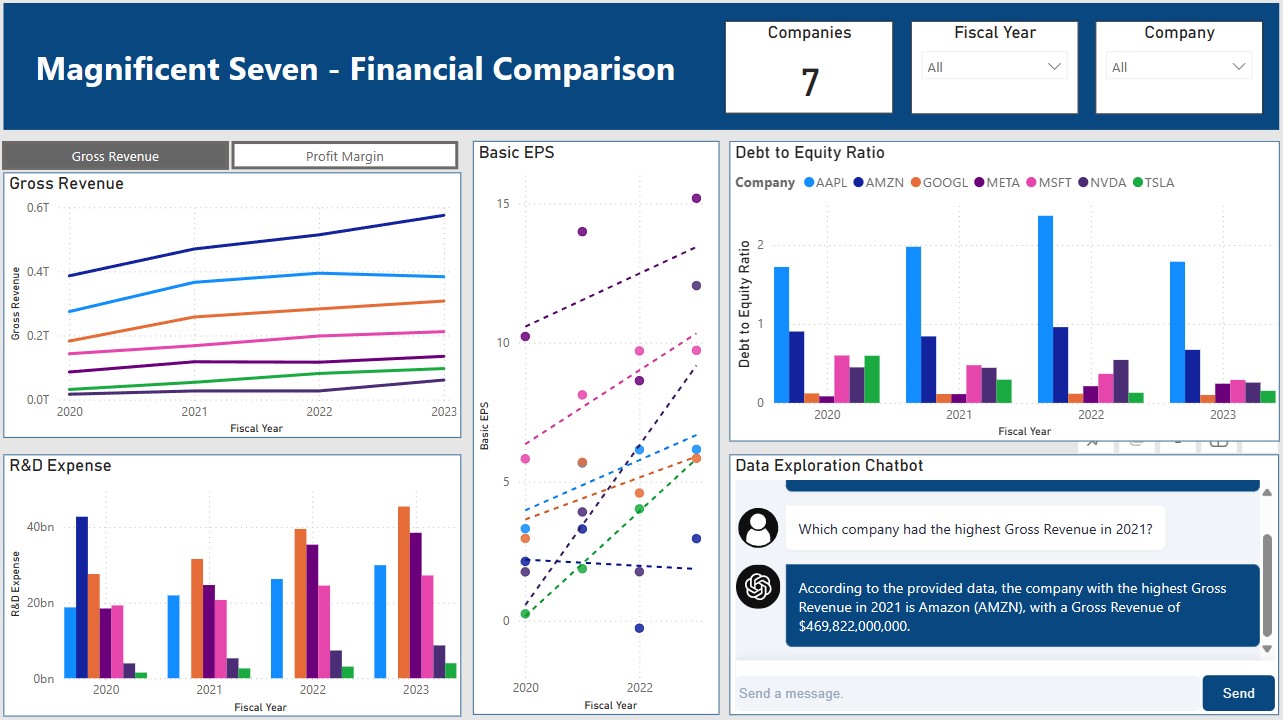
The real fun began as I crafted a dashboard to analyze the "magnificent seven" tech stocks. This illustrative dashboard compares common financial metrics for these tech giants across a four year span. I elected to make use of several different chart formats and also integrated a chart with a toggleable measure. There are numerous metrics and angles that could be considered with the financial data, and perhaps I will add to the dashboard's functionality in time.
Step 7: Enhancing with AI
To take this project to the next level, I incorporated an LLM chatbot into the dashboard. After downloading a custom Power BI visual that supports LLM, I integrated this feature, enabling users to interact with the dashboard through conversational AI. This addition transformed the dashboard from a static display into an interactive experience.
Step 8: Going Live
The final step was to publish the dashboard to my Power BI workspace and establish a real-time data connection with MySQL. This allows for up-to-the-minute data refreshing and ensures that the insights are as current as possible.
What I Learned
This project was not just about building something functional and showcasing my abilities; it was about pulling several technologies together in meaningful ways to create something cutting-edge. The blend of traditional data analytics with burgeoning AI capabilities exemplifies the future of business intelligence.
Closing Thoughts
I hope this walkthrough inspires you to explore the potentials of integrating AI into your data projects. Remember, it's not just about the data or the technology; it's about how these tools can enhance our understanding and decision-making capabilities in the business world. Dive in, experiment, and let the data lead the way to innovation!