
I wanted to see how far I could push Power BI beyond static charts, and whether a conversational AI layer on top of financial data was actually useful or just a party trick. Spoiler: it’s useful, within surprisingly specific limits. Working out exactly where those limits are was the most interesting part of the project.
The setup: a dashboard covering four years of financial data across the “Magnificent Seven” tech stocks, with an LLM chatbot embedded directly in the report.
Setting Up the Foundation
Every project starts with version control. I set up a GitHub repository to keep the code organized from the start, useful even when working solo, since financial data scripts have a way of multiplying.
Gathering the Data
The data source is Yahoo Finance, pulled via the yfinance Python library. It gives clean access to historical financial statements and market data with minimal setup: income statements, balance sheets, and cash flow data all come back as pandas DataFrames, no scraping or API key required. A Python script handles the fetch and shapes the raw data for downstream use.
Preparing and Storing the Data
With raw data in hand, I used pandas to parse the financial statements and transform them into a structure suitable for the dashboard. The trickiest part was normalizing the multi-level column headers that yfinance returns for certain financial statements. The processed data lands in a local MySQL database, schemas defined up front, integrity enforced at the insert layer.
Building the Dashboard
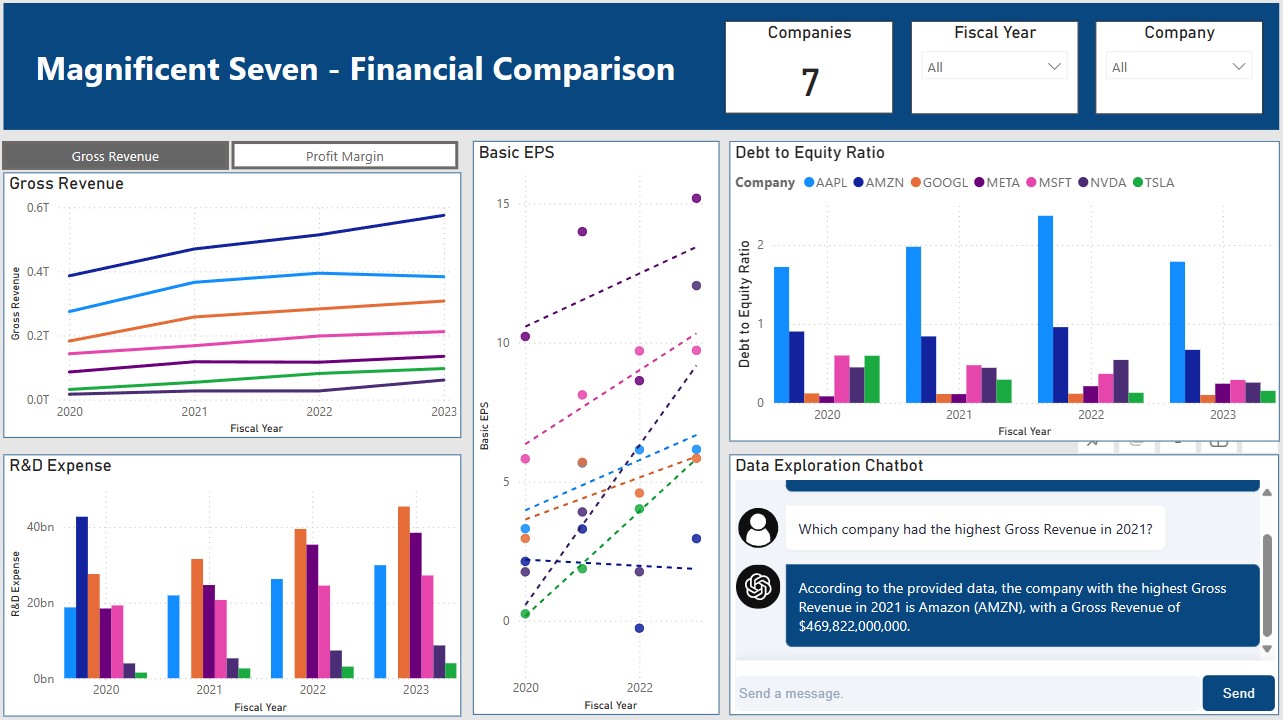
Power BI connects directly to the MySQL database, which keeps the data refresh path simple. The dashboard itself covers common financial metrics for the Magnificent Seven across a four-year span, using a mix of chart types and a toggleable measure to let users compare across different metrics. There’s a lot more that could be layered in over time.
Adding the LLM Layer
This was the interesting part. I integrated a custom Power BI visual from Lens that supports connecting an LLM to the report. With it wired up, users can ask questions about the data in natural language and get responses grounded in what’s actually on the dashboard. It turns a read-only display into something more like a conversation.
Publishing and Refresh
The final step was publishing to my Power BI workspace and establishing a live data connection to MySQL, enabling automatic data refresh so the dashboard stays current without manual intervention.
What I Took Away
The technical stack here (Python for ingestion, MySQL for storage, Power BI for visualization, LLM for interaction) is a reasonable pattern for a lot of internal analytics tools. Each piece is independently replaceable, which matters in practice.
The LLM integration was genuinely useful for exploratory questions (“which company had the highest gross margin in 2022?”) but broke down quickly for anything requiring precise multi-step calculations. The lesson: AI layers on top of dashboards work best when the underlying data is already well-structured and the questions are bounded. The dashboard is a better starting point for analysis, not a replacement for it.